
The ability to make confident business decisions, build reliable AI models, and maintain trustworthy analytics in insurance underwriting all rely on data quality. What exactly does data quality in insurance represent? How can organisations systematically measure and improve their data quality?
In this article, we’ll explain and show you how insurance carriers and MGAs can use AI to measure, monitor, and improve completeness, precision, and accuracy.
TL;DR (Too Long; Didn’t Read)
- Data quality in insurance directly impacts underwriting accuracy, claims efficiency, and customer trust.
- Key data quality dimensions, completeness, precision, and accuracy, ensure reliable analytics and AI models.
- AI can automate data profiling, detect anomalies, and predict missing or incorrect values.
- Embedding data quality metrics into pipelines turns reactive data cleaning into proactive governance.
- Bound AI helps insurers monitor, measure, and improve data quality, turning trustworthy data into a competitive advantage.
What is Data Quality in Insurance?
Data quality in insurance refers to how accurate, complete, consistent, and timely an insurer’s data is across all its systems and processes. High-quality data ensures that policy details, customer information, claims records, and risk assessments are correct and up to date.
Insurance underwriting decisions depend on trustworthy data. Poor data quality leads to mispriced policies, delayed claims, compliance risks, and lost customer trust. When insurers maintain strong data quality standards, they gain clearer risk insights and improve operational efficiency.
What are Data Quality Metrics in Insurance?
Dimensions of data quality are the qualitative aspects, and in insurance, those include accuracy, completeness, precision, consistency, and more.
Data quality measures are pure numbers, for example, 135 missing contact details out of 1000 files. Data quality metrics are usually expressed as percentages or ratios, enabling monitoring results over time.
Why Data Quality Matters in Insurance Underwriting
Before explaining each metric in more detail, it’s worth pausing to consider why data quality matters so much. Multiple sources emphasise that when data is poor, everything that relies on it can go off the rails.
Analytics, reporting, automation, and operational decisions all suffer consequences of poor data quality. Poor data quality in insurance leads to misinformed choices, wasted time and resources, and compliance risks.
What Are the Most Important Data Quality Dimensions in Insurance?
While there are many dimensions of data quality, let’s explore three that are especially crucial: completeness, precision, and accuracy.
Completeness
Completeness refers to whether all required data is present and all necessary fields are populated.
Suppose you have customer records, and the phone number or address fields are missing in many rows. In that case, your completeness is low, and any campaign, service, or analytics relying on that data will be limited or skewed.
Completeness Metrics
Some completeness metrics include fill rate, record completeness ratio, and count of empty values.
To measure the fill rate, let’s take an example of 1000 records. If 850 of those have a valid phone number entered, the phone number fill rate will be 850/1000 = 0.85, or 85%.
Record completeness ratio is the number of records with all required fields divided by the total number of records. Again, if there are 850 satisfying records out of 1000, the ratio will be 850/1000 = 0.85.
The empty values count is a plain number of records with missing information, which is 150 in our example. The exact formula is the total number of records minus the number of completed records.
How to Measure Completeness with AI
AI and machine learning can help by automating data profiling at scale, predicting missing values, and highlighting specific patterns and correlations. AI and machine learning work together to identify which fields are commonly empty, compute fill rates, and detect trends of data drift.
Predicting missing values with ML provides a suggestion to the human reviewer, based on previous examples with similar parameter values.
By integrating completeness metrics into a data-observability platform, you can set alerts when fill rate drops below a threshold, trigger cleaning workflows, or escalate to data owners.
Precision
Precision refers to the level of detail or granularity of your data. It’s about how specific and consistent the information is, rather than whether it’s correct. For example, if you store a location as “New York” instead of “123 Main Street, New York, NY,” the data is less precise. Low precision can limit the usefulness of analytics, segmentation, and predictive models.
Precision Metrics
Some useful precision metrics include granularity ratio, precision adequacy score, and variability rate.
Granularity ratio compares the actual recorded detail level to the required level. For instance, if the business requires street-level addresses but only 80% of the records contain full addresses, the granularity ratio is 0.8.
The precision adequacy score measures the number of values that meet a predefined precision standard. For example, if financial transactions should be recorded to two decimal places, but only 900 out of 1,000 meet that rule, the adequacy score is 90%.
The variability rate evaluates the consistency of repeated or duplicate measurements. A high variability rate indicates inconsistent data precision across entries.
How to Measure Precision with AI
AI can detect precision issues automatically by spotting patterns or anomalies that suggest reduced granularity. For example, machine learning models can flag when sensor data suddenly shifts from decimal to integer readings or when customer data becomes less detailed after a system update.
AI systems can also learn expected precision levels from historical data and alert teams when new data falls short of those expectations. By integrating precision checks into a data observability platform, you can continuously monitor changes in data granularity, prevent information loss, and maintain consistent data quality standards.
Precision is often less obvious than completeness and is often overlooked. With AI, you won’t have to worry about overlooking anything, and the system never gets tired.
Accuracy
As another extremely important data quality dimension, accuracy measures how closely your data matches real-world values. Accuracy comes after completeness and precision, because for data to be accurate, it must first be complete and precise.
For instance, an outdated customer address or a policy number linked to the wrong individual both reduce accuracy. Accurate data ensures better decision-making, reliable analytics, and trustworthy customer interactions.
Accuracy Metrics
Common accuracy metrics include error rate, percentage of correct values, and rule violation rate.
Error rate measures the number of incorrect records divided by the total number of records. Let’s say 250 out of 1,000 entries have wrong or outdated information; the error rate is 25%.
The percentage of correct values can be measured by comparing data to a trusted reference source or ground truth. For example, verifying customer addresses against a postal database.
Rule violation rate checks how many values fall outside logical or business rules, such as negative ages or future claim dates.
How to Measure Accuracy with AI
AI can assess and improve data accuracy using validation models, anomaly detection, and external data verification. Machine learning algorithms can compare existing data against trusted sources, flag discrepancies, and even suggest likely corrections.
AI can also estimate the probability that a given value is correct based on historical accuracy patterns. By incorporating these insights into your data pipeline, you can prioritize which records to review, automate correction workflows, and maintain consistently reliable data across systems.
Data Quality Best Practices in Insurance
To effectively embed insurance data quality metrics into AI operations, start with a focused, high-impact dataset before scaling across domains. Define clear thresholds for completeness, precision, and accuracy, and automate continuous monitoring with data observability or machine learning tools.
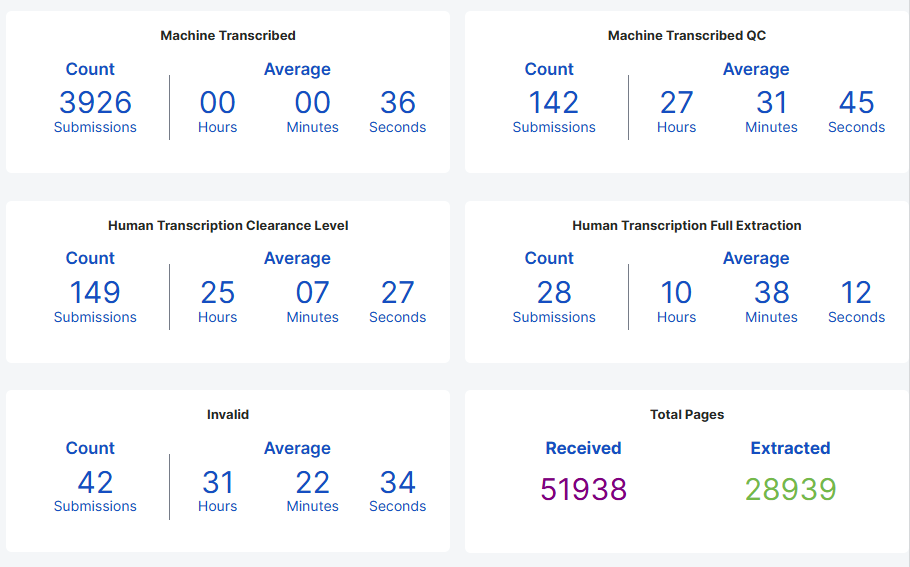
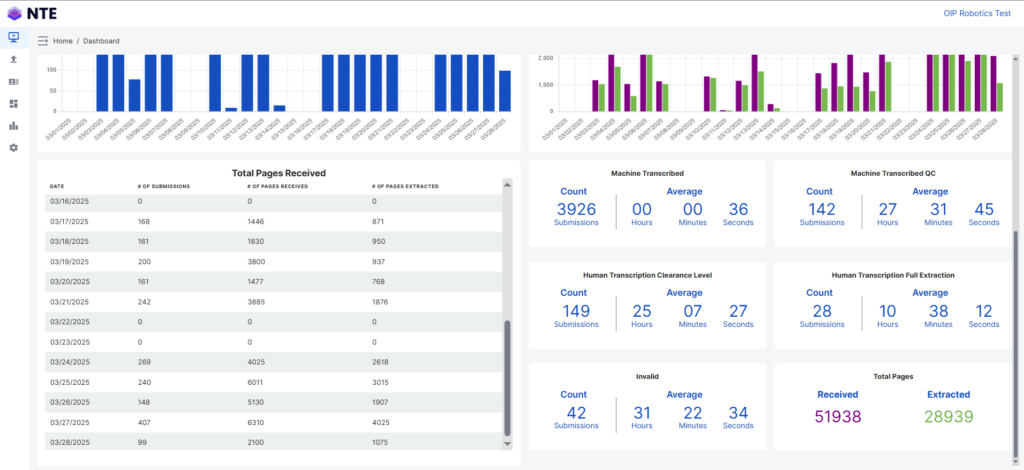
Make metrics visible through dashboards to promote transparency and accountability, and link improvements directly to measurable business outcomes like cost savings, revenue growth, or model performance gains.
Integrate quality checks into data pipelines from the start, and use AI not only to detect issues but also to suggest or perform remediation. Always keeping human oversight for critical cases. Finally, revisit thresholds and processes regularly, as data quality needs evolve with business objectives and technology.
Turning Data Quality into a Competitive Advantage: Bound AI
Bound AI is a data intelligence platform that empowers organizations to measure, monitor, and improve data quality using advanced AI-driven insights. Our platform automates profiling, detects anomalies, and tracks key metrics, such as completeness, precision, and accuracy across systems.
With intuitive dashboards and seamless integration into existing pipelines, Bound AI transforms raw data into a trusted, high-performing asset—helping teams make faster, smarter, and more confident decisions.
Interested? Click here to get started.
The Bottom Line
High-quality data in the insurance industry is the foundation of reliable analytics and confident business decisions. By focusing on key metrics and using AI to measure them, insurance organizations can achieve scalable growth and improvement.
Bound AI makes this transformation possible by bringing intelligence, automation, and visibility into every stage of the data lifecycle. Let’s build the future of insurance together.
