
Loss runs are the underwriter’s version of a minefield. Essential? Yes. Easy? Never.
Every submission with a multi-year claims history comes buried in PDFs – different formats, inconsistent labels, pages of scanned tables. Underwriters spend hours just trying to understand what they’re looking at. One report says “Total Paid.” Another says “Total Incurred.” A third is missing 2021 entirely.
It’s tedious and risky. A missed open claim, a mistyped reserve, or an overlooked frequency spike can derail pricing, or worse, get through to bound policies unnoticed.
And yet, underwriting teams still waste thousands of hours every year manually extracting and interpreting loss runs. According to one report, simply re-keying loss run data costs large insurers up to $3.7 million annually in labor and compliance risk.
But it doesn’t have to be this way.
Loss run automation replaces hours of copy-paste work with clean, structured insights, delivered in minutes. The right tools don’t just read the reports; they flag anomalies, summarize trends, and plug straight into your workflow.
We’ll break down exactly how this shift happens and why AI-powered loss run analysis isn’t just faster, but smarter.
TL;DR
Manual loss run review slows underwriting, drains resources, and misses key risk signals.
In this article, you’ll learn:
- Why underwriters waste hours untangling inconsistent loss run PDFs
- How AI automates data extraction, normalization, and analysis
- What Bound AI’s Loss Run Analysis Agent does differently and instantly
- Why automation leads to faster quotes, cleaner data, and better pricing decisions
- How scalable, explainable loss run automation gives your team a strategic edge
Loss runs don’t have to be a bottleneck. With the right infrastructure, they become your fastest source of insight.
Why Manual Loss Run Analysis Is Broken
Every underwriter knows the feeling: a new submission lands with a stack of attachments, and somewhere in that stack is a 30-page loss run PDF. It’s from three different carriers. One is scanned. One has no claim descriptions. One stops in 2022.
And your job is to make sense of it – fast. It’s not analysis. It’s survival.
Loss runs are supposed to help underwriters assess risk. But in reality, they create friction from the first second.
The usual problems
- No standard format. Each carrier has its own layout, terminology, and logic. There’s no universal template. “Total Paid” might be labeled “Incurred to Date” in one report and buried under abbreviations in another.
- Unstructured data. Most loss runs arrive as PDFs, often in the form of scanned images. No formulas, no structure, just tables locked in pixels.
- Manual extraction. Someone has to open the file, identify what’s relevant, and retype it into a spreadsheet or system. Claim by claim. Year by year.
- High error rates. Even when the work is done carefully, humans miss things. Studies show manual data entry in insurance can carry error rates as high as 10–12%.
- Massive time cost. For complex accounts, analyzing a full loss history can take hours. Multiply that by dozens of submissions a week, and you’re talking full-time work just to prep the data.
And speed is not the only problem. Every delay in reviewing loss runs slows down quoting, prolongs renewals, and frustrates brokers waiting for decisions. Every error can lead to mispriced coverage or missed red flags.
It’s a broken system and it scales terribly.
The more you grow, the worse it gets. More submissions, more carriers, more pages to comb through. Underwriters can’t keep up. Ops teams burn out. And leadership is left choosing between hiring more people or slowing down growth.
Manual loss run review isn’t just inefficient. It’s operational debt. And every time you defer solving it, you pay the interest.
What Underwriters Really Need from Loss Runs
Underwriters don’t need another PDF. They need a fast, accurate answer to a simple question: What kind of risk is this?
Loss runs should provide that answer. But the way they’re delivered – scattered formats, inconsistent terms, missing context – forces underwriters to spend hours reconstructing what should already be obvious.
Here’s what underwriters are actually trying to extract:
- A clear picture of loss frequency and severity. Is this a high-severity, low-frequency account, or the opposite? Are losses clustered in a specific year? Is this just bad luck or a trend? Without structured summaries, these patterns are buried in raw tables that don’t speak for themselves.
- A breakdown by cause of loss. What’s driving the claims? Slip-and-falls? Fire? Equipment breakdowns? Property damage? Underwriters need to determine if the exposures align with what is covered or if the account is a mismatch waiting to happen.
- Open vs. closed claims and reserve behavior. An account with five open claims totaling $900K in reserves carries a different risk than one with 20 small, closed claims. But with no standard structure, it’s easy to overlook open statuses or inflated reserves.
- Gaps and anomalies. Are there missing years? Sudden spikes in frequency or severity? Unusual loss ratios? These are warning signs. But spotting them manually requires time, concentration, and a lot of spreadsheet gymnastics.
- Consistency across all carriers. When submissions include loss runs from multiple insurers, underwriters must reconcile wildly different formats to get a unified view. That’s not a value-added task but a bottleneck.
At its best, loss run data should fuel fast, confident decision-making. But under current conditions, it slows everything down.
Underwriters aren’t asking for magic. They simply want clean data, a consistent structure, and clear signals, without spending half their day extracting numbers from PDFs.
How Loss Run Automation Works
Loss run automation isn’t a faster version of manual review. It’s a complete redesign of how the data gets processed.
Instead of asking a human to open a PDF, scan for claim info, and retype it into a spreadsheet, automation breaks the job into four intelligent steps, each one handled by AI.
1. OCR turns static files into usable data
Most loss runs arrive as unstructured PDFs. Some are exported neatly from carrier portals. Others are scanned documents or grainy images.
Optical Character Recognition (OCR) is the first gate. It converts those static pages into machine-readable text, tables, rows, and even handwritten annotations. Good OCR handles edge cases: rotated scans, multi-column layouts, and inconsistent formatting. Without this, automation doesn’t even get off the ground.
2. NLP and parsing extract key data points
Once the text is readable, Natural Language Processing (NLP) takes over. The AI identifies and extracts fields like:
- Claim numbers
- Dates of loss
- Paid amounts
- Reserved amounts
- Causes of loss
- Claim status (open/closed)
- Total incurred
This isn’t just keyword matching. It’s context-aware extraction. The AI understands variations in phrasing, maps carrier-specific labels to standard fields, and ignores noise (e.g. footnotes, disclaimers, page headers).
3. Machine learning normalizes and organizes the data
Loss runs are messy. One might say “Total Paid,” another “Paid to Date.” One displays reserves as a separate field, while the other combines them into a single number.
Machine learning maps those variations into a consistent structure. It also links related line items (e.g., a claim split across two rows), detects missing data (e.g., a skipped year), and flags outliers in reserve levels, frequency, or loss ratio.
This step transforms a swamp of inconsistencies into a clean, normalized dataset—one that’s ready for actual analysis.
4. Summarization and red flagging generate instant insight
The final layer produces what underwriters actually want: insight, not noise. The AI delivers summaries like:
- Total incurred losses by year
- Loss ratio trends
- Open claim counts
- Top causes of loss
- Anomalies: spikes, outliers, missing years
Some systems even provide plain-language writeups – e.g., “Losses spiked in 2022 due to multiple large water damage claims. Frequency and severity declined in 2023. One open reserve remains above $100K.”
You’re not just getting structured data. You’re getting a risk narrative.
Built for underwriters, not data scientists
Loss run automation doesn’t require rules-based mapping or templates for every carrier. A properly trained AI model adapts to various formats, learns from new patterns, and consistently produces clean results.
It doesn’t get tired. It doesn’t miss fields. And it doesn’t need to be retrained every time a carrier updates its export layout.
It’s infrastructure for underwriting at scale.
Meet the Loss Run Analysis Agent
You’ve seen what a manual loss run review looks like. You’ve seen how automation works in theory.
Now here’s what it looks like in practice with Bound AI’s Loss Run Analysis Agent.
This agent isn’t a plug-in or a glorified parser. It’s a digital coworker—purpose-built to handle the one task underwriters waste the most time on: reading, interpreting, and structuring messy, multi-carrier loss runs.
Here’s what it does, step by step:
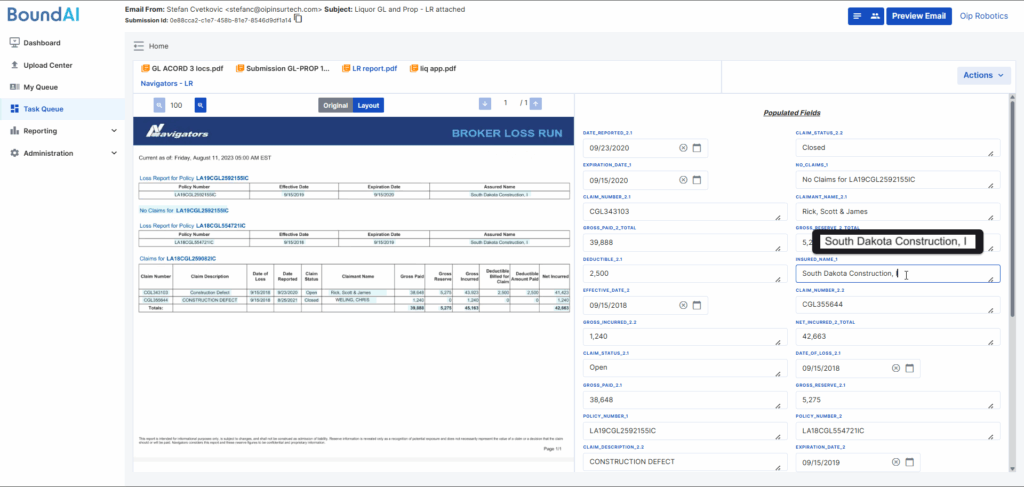
1. Ingests and understands any loss run, no templates needed
Drop in any PDF. It doesn’t matter if it’s a pristine export or a scanned, low-resolution attachment.
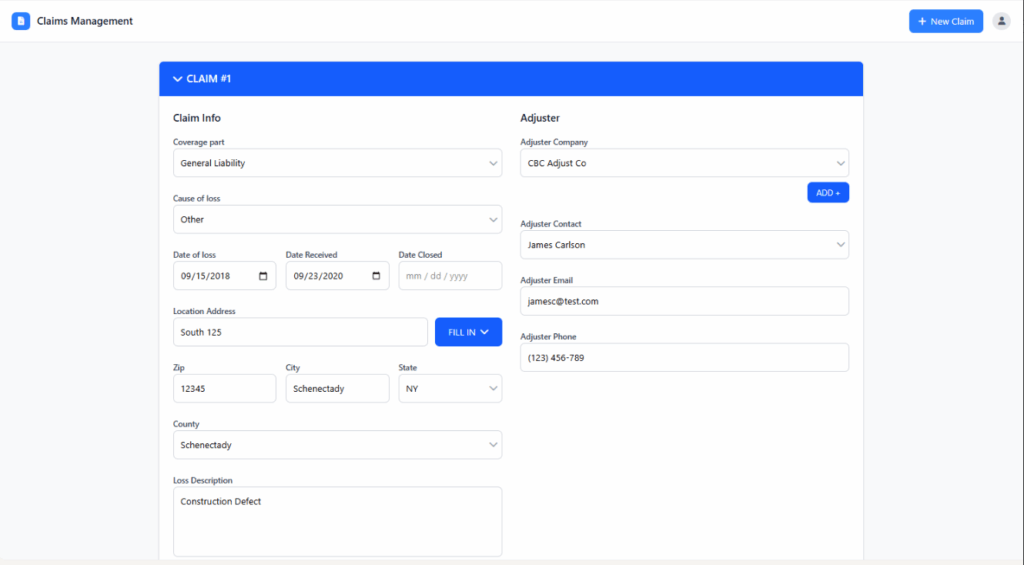
The agent extracts all relevant data: dates of loss, reserves, payments, causes, and claim statuses, without needing manual mapping or format training.
2. Normalizes everything into a clean, unified structure
Whether you’re looking at one loss run or ten, from one carrier or five, the agent standardizes all values into a consistent schema.
You’re not toggling between inconsistent labels. You’re looking at a clean dataset that’s immediately usable.
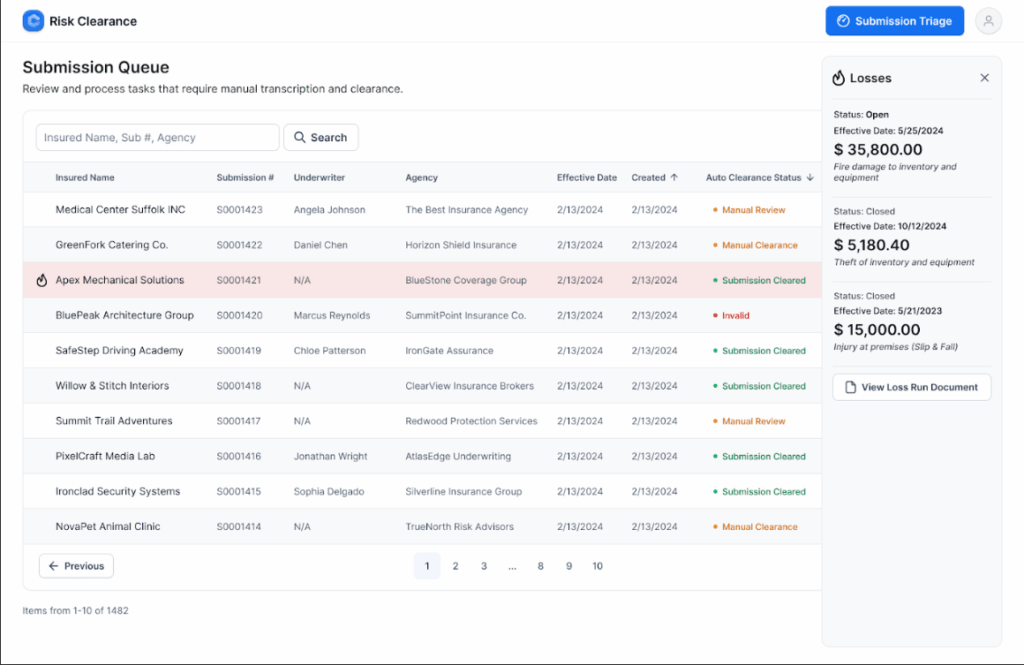
3. Spots red flags
The agent doesn’t just extract – it evaluates. You’ll see alerts for:
- Missing policy years
- High reserve-to-paid ratios
- Loss frequency spikes
- Single large-loss outliers
No need to dig. The agent instantly surfaces what underwriters care about most.
4. Outputs structured JSON or ready-to-use spreadsheets
Once processed, the loss data is export-ready. You can plug it into your internal models, dashboards, or submission workflows.
No formatting. No fixing. Just structured, decision-ready data.
5. Includes a plain-language summary for fast context
The agent generates a narrative overview of the loss history, highlighting trends, spikes, and anomalies in clear, human-readable language.
It’s not a data dump. It’s a briefing.
6. Fully explainable and audit-ready
Every field extracted, every anomaly flagged, every pattern detected – it’s all traceable. You gain visibility into what the agent saw, how it interpreted it, and why it flagged the issue.
With the Loss Run Analysis Agent, you’re not asking your team to go faster.
You’re removing the thing that slows them down in the first place.
The result?
Submissions that move in minutes. Decisions that happen with confidence. Underwriters doing what they were hired to do, not drowning in PDFs.
Real Results: What Automation Unlocks
Speed and accuracy sound great. But what does loss run automation actually change in practice?
With Bound AI’s Loss Run Analysis Agent in place, here’s what insurance teams are seeing daily.
90%+ reduction in processing time
What used to take a full-time analyst 2–3 hours per submission now takes less than 10 minutes. There’s no toggling between PDFs, spreadsheets, and rating tools. Just clean, usable data – There’sfast.
That time savings doesn’t just make things faster. It frees up underwriting capacity, shortens the quoting cycle, and removes a persistent operational bottleneck.
Data accuracy without human fatigue
The agent processes claims with consistent logic across every submission. No missed claims. No “I must’ve overlooked that row.”
Structured output = fewer pricing errors and no nasty surprises after binding.
And when needed, your team can still review and validate the structured results without doing the work from scratch.
Consistent decisioning at scale
Every submission, regardless of carrier or format, goes through the same logic. That means underwriters are working from a consistent view of the data, one that can’t be skewed by sloppy formatting, confusing labels, or missing context.
It’s cleaner and more defensible.
Whether you’re justifying pricing, reviewing a renewal, or preparing for an audit, the structured output and plain-language summary provide a reliable and traceable record.
Built to integrate, ready to grow
You don’t need to change your core system to use it. The Loss Run Analysis Agent seamlessly integrates into your existing workflow, whether you’re triaging submissions, preparing for underwriting review, or bulk-processing renewals.
And because it doesn’t rely on templates or rigid formats, it scales effortlessly.
More volume? More carriers? No problem.
The Bottom Line
Loss run analysis used to be a cost of doing business. Now, it’s a cost of doing things the old way.
The problem was never the underwriter. It was the process – hours spent untangling PDFs, reconciling carrier formats, and hunting for red flags buried in tables. That’s not analysis. That’s manual survival.
Bound AI’s Loss Run Analysis Agent changes that.
It ingests any loss run, automatically structures the data, flags the outliers, and summarizes the risk. What took hours now takes minutes. What required full-time capacity now runs in the background. And what was once error-prone is now auditable and explainable.
With loss run automation, give your underwriters the leverage they need to focus on making smarter, faster decisions with better data.
If your team is still combing through PDFs, you’re leaving time, money, and underwriting quality on the table.
It’s time to move loss run analysis out of the inbox that’sand into infrastructure that’s built to scale.
